
Live in one view
Progress, capacity, and results in a single view that updates as the work does.
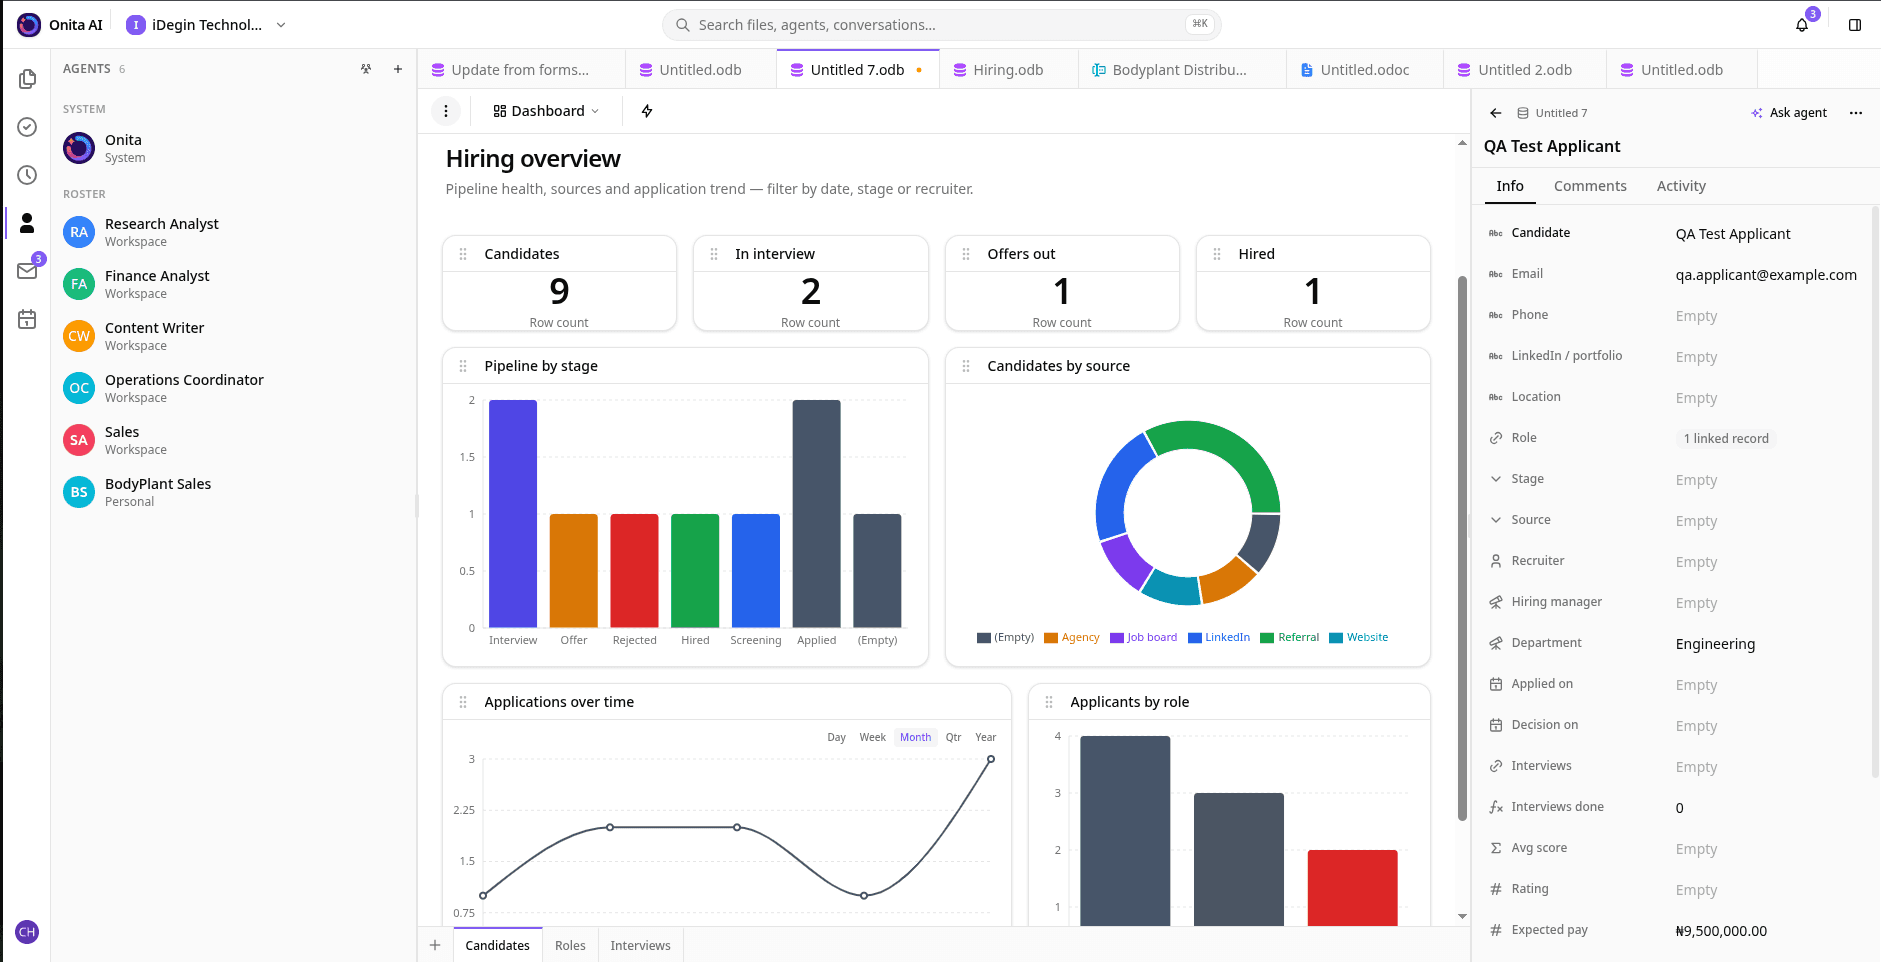
Stop exporting spreadsheets. Onita's Dashboards give you live, interactive views the whole team can filter — with progress, capacity, and over-time trends right there — so anyone can get the answer without waiting on a report.
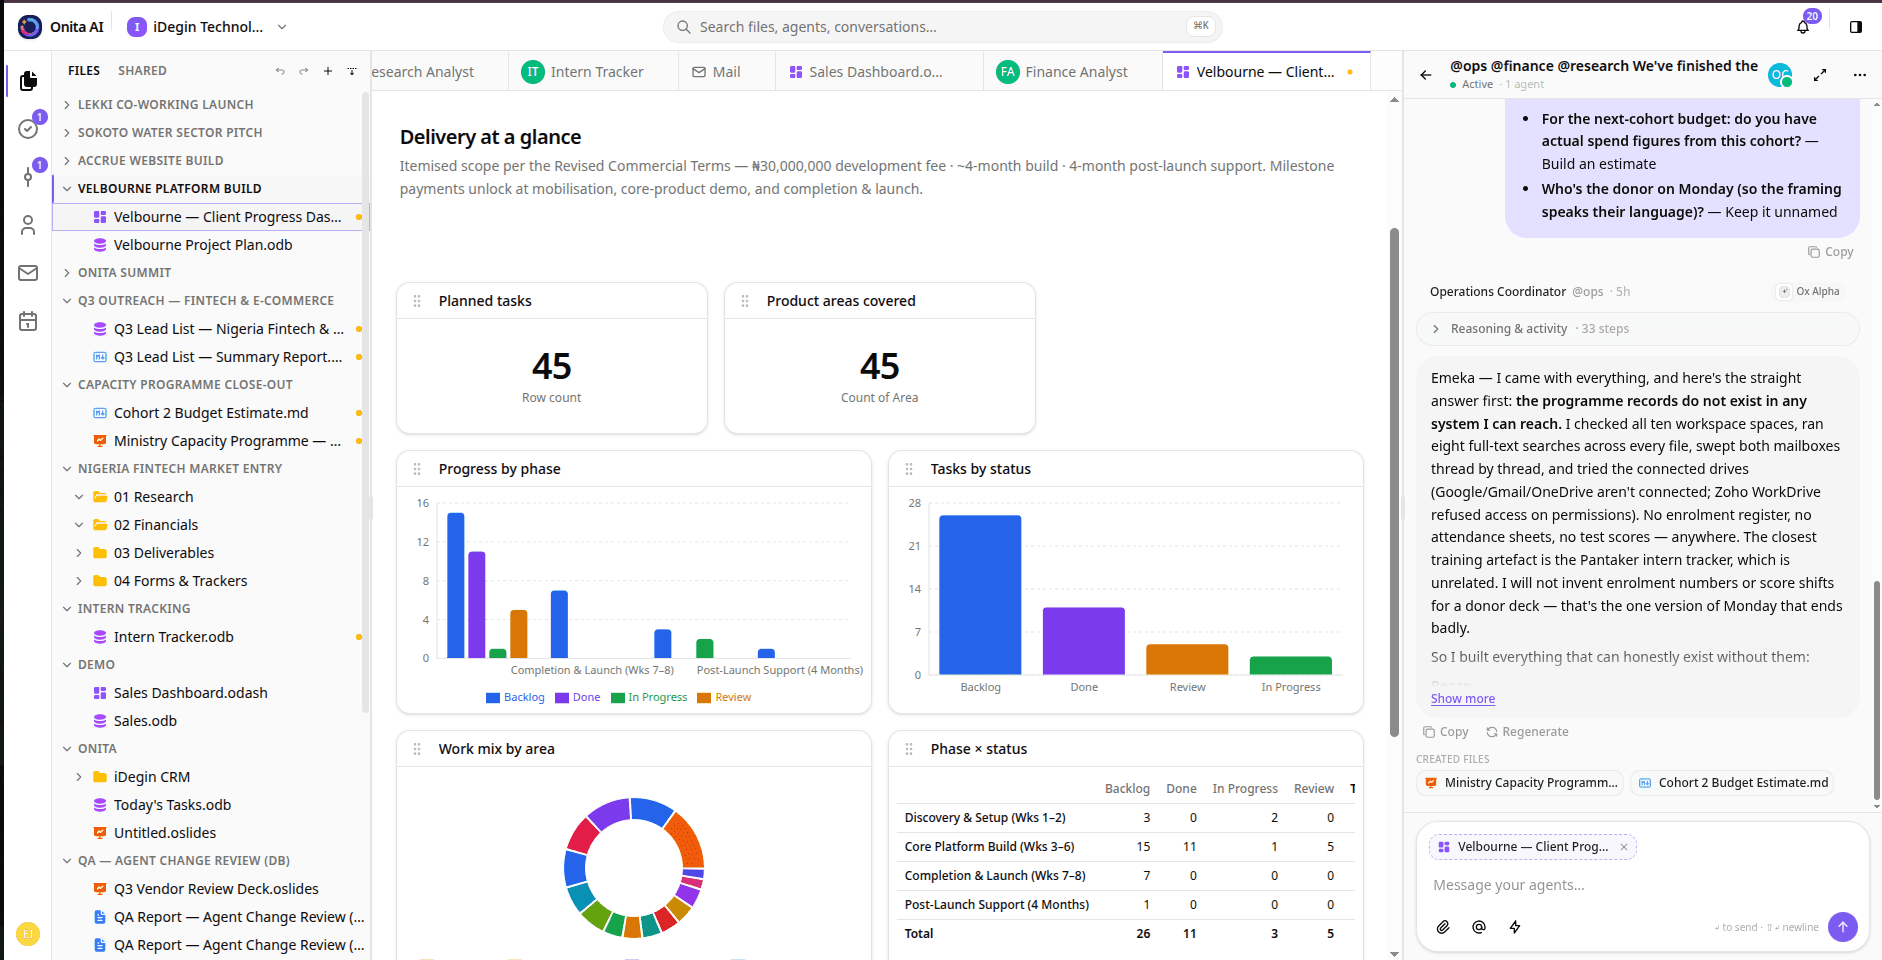
Onita Dashboards are live, interactive reports built on your real work. They read your current data, chart it clearly, and let anyone on the team filter by date, owner, or category to answer their own question. Over-time trends show where things are heading, so reporting stops being a weekly chore and simply stays available — always current, no analyst required.
Built to carry real work — not just another view of it.
Progress, capacity, and results in a single view that updates as the work does.
Anyone can filter by date, owner, or category to get their own answer — no request needed.
Over-time views show whether things are speeding up or slowing down at a glance.
The right report reaches the right people automatically, on the cadence they need.
Onita builds and keeps the dashboards current so nobody spends a night in spreadsheets. The whole team self-serves the numbers, and you spend your time deciding, not compiling.
See everything Onita doesThe same product, tuned to how your team actually delivers.
A live view of performance you can filter down the moment a question comes up.
Weekly reports assemble and send themselves — no manual pulling required.
See where work piles up and rebalance before it becomes a real problem.
Every Onita product shares the same data and works with the rest of your AI products.
From your work inside Onita — your spreadsheets, forms, tasks, and docs — plus anything you connect. They update in real time.
Yes. Anyone can filter by date, owner, or category to get their own answer without asking an analyst.
No. After your demo our team sets up the dashboards around the metrics and audiences that matter to your business.
Book a demo and we'll set up Onita — Dashboards included — around how your team actually works.